My favorite regional transit maps
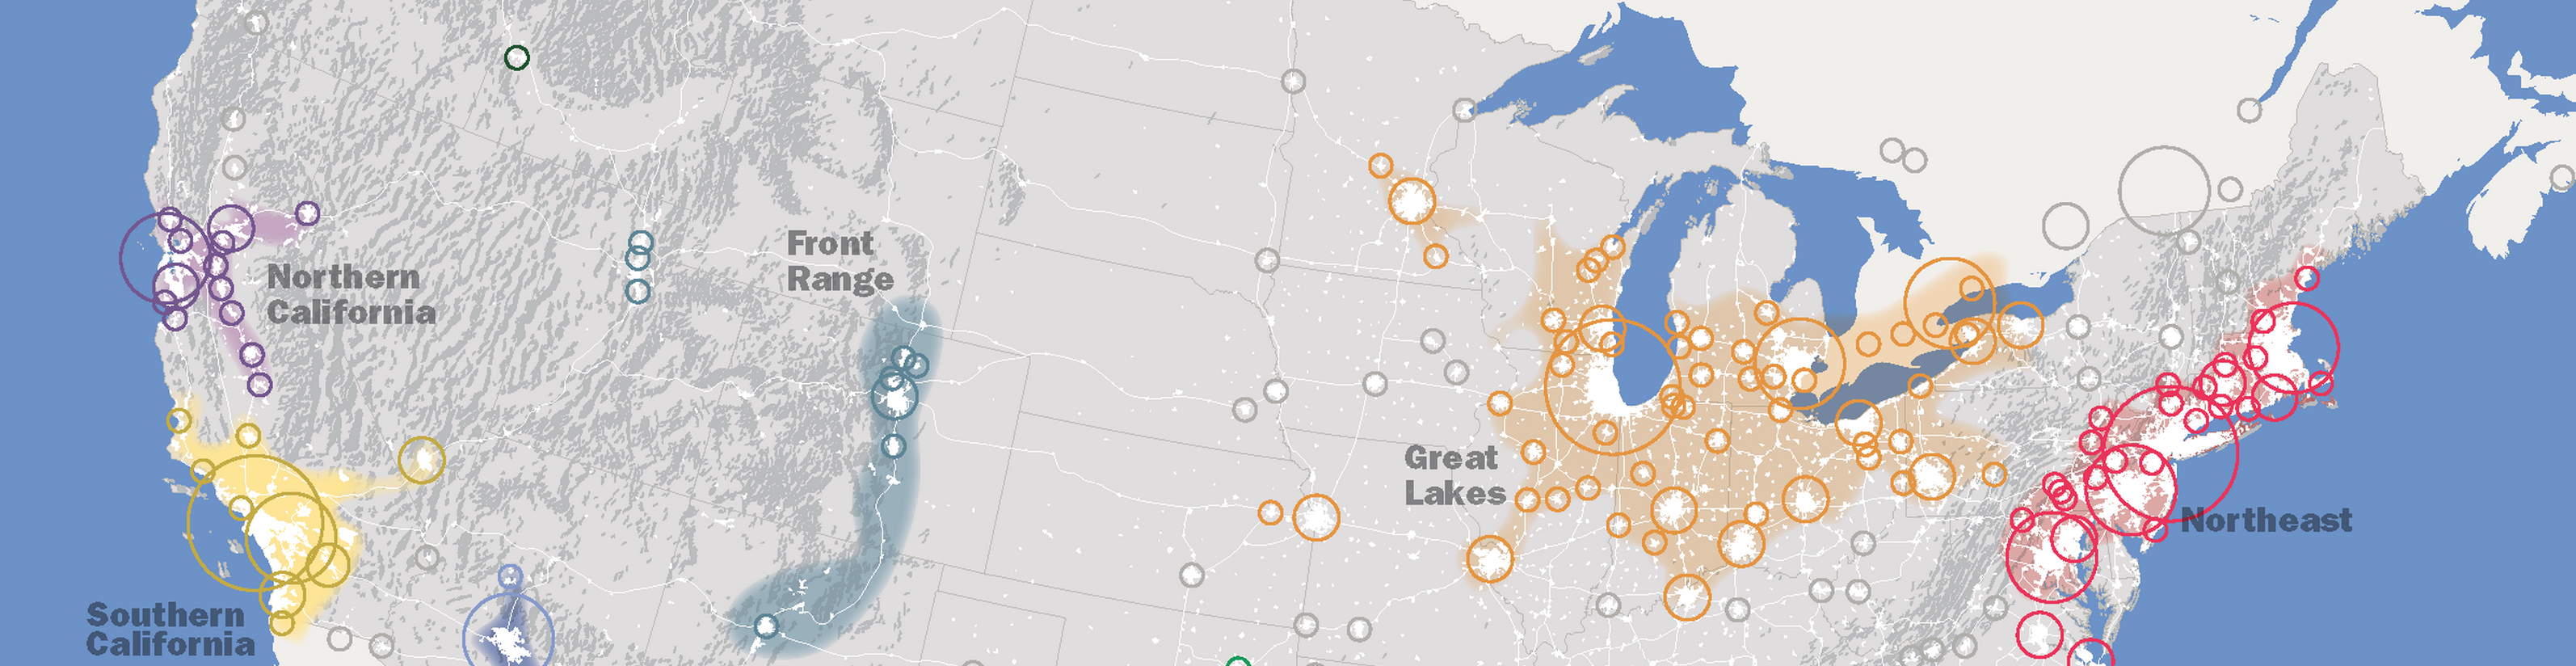
Megaregions of the U.S. (original at America 2050)
I've been working on a post about riding local transit from New York City to Boston. While writing, I've run into some really neat regional transit maps, which cover an entire metropolitan area, cluster of metropolitan areas, or region of the United States. They focus on commuter and intercity services, as opposed to metro maps covering local subway and sometimes bus lines. A regional map, I say, encompasses multiple transit agencies and at least two major cities. These maps are often made by transit fans or urbanists with an agenda.
Though we think of maps as products of public transit agencies, many agencies have mediocre map design, or they have decent maps for their own service, but they don't bother to map out relevant services running in an adjacent area or under a different agency.1 On San Francisco Muni's city-wide map, you'll see the N line extend an hour out to Ocean Beach, but you won't see the 15-minute BART ride to Oakland.
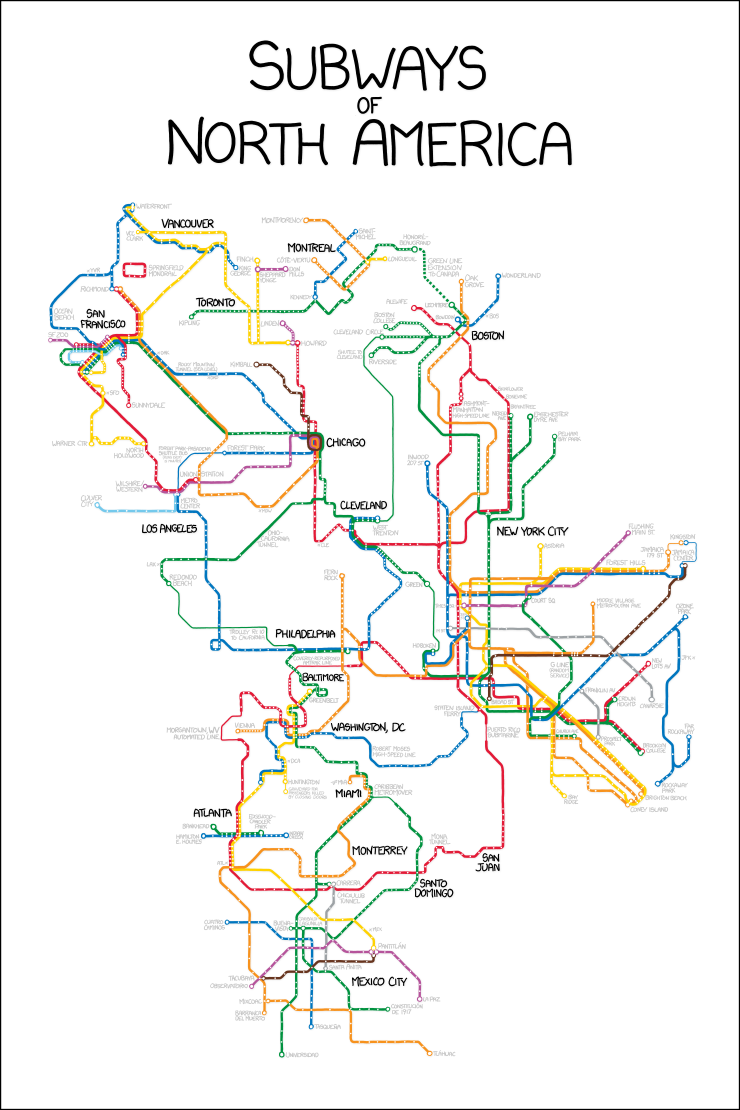
Subways of North America (original xkcd)
I want to see maps that tell you how you can connect and how far you can go: Subways of North America in real life.2 (I like metro maps and city-level maps too! But no one has really talked about region-wide maps, especially not in the U.S., where they're mostly a hobbyist affair.) To be honest, many of the routes highlighted here aren't practical. I just like seeing that they exist. I feel a sort of chill when I see a train pull in on time and hear the clean computerized voice sound off its line and destination. It feels like things are under control.
I'm conflating two different dimensions of cool by making this list: what information the map contains, and how pretty it is. Cameron Booth's Transit Maps Tumblr does a good job reviewing the latter, and I actually found some of these maps there. But I want to write about regional network maps specifically, and I'd like to highlight some maps Transit Maps hasn't covered.
Interestingly, among these maps, I see a tradeoff between information content and clean design. The more information they pack in, the worse the design gets.
These maps focus on the Northeast region of the United States, particularly the New York City metropolitan area (including New York City, Newark, and Jersey City, among others), and California, particularly the San Francisco Bay Area (including San Francisco, Oakland, and San Jose, among others).3
I critique some of these maps, but I'm listing them here in the first place because I really like each one for some reason or other, and I believe they illustrate things you can't see anywhere else.
San Francisco Bay Area Rail Transit (Steve Boland)
San Francisco Bay Area Rail Transit (enlarge)
This map, designed by Steve Boland, aims to show you all the passenger rail lines in the Bay Area. It achieves that goal very well; it's a great diagrammatic map, clean and readable.
It looks better on a glance than Brian Stokle's map of the same geographical area (below), but it also doesn't give you nearly as much information. The two maps have different aims. This map doesn't have key bus routes,4 and it doesn't show local and express service as separate lines. Steve also doesn't indicate individual BART or Muni lines, except in the terminal markers. (Transit Maps does have an older revision with line separation.)
Steve Boland has some other excellent transit maps at CalUrbanist (formerly SF Cityscape), including frequent-network maps of the East Bay and San Francisco proper.
Bay Area Transit Mobility Map (Brian Stokle)
Bay Area Transit Mobility Map (enlarge at Urban Life Signs)
Brian Stokle made this map in 2012 for The Urbanist magazine, along with a 'fantasy' map of future Bay Area transit.
I like the extra information you get, like separate local and express lines,5 but the map feels cluttered to me, especially compared to the last map. It uses a lot of thin outlines, borders, and gaps between lines (see its design for "Transfer Zone"). Thin outlines are a strain to read. Brian doesn't use uniform slopes, but he does use straight lines; it's a compromise between a diagram (like the previous map) and a geographically accurate map, and it leaves the map seeming distorted.
The bus choices and bus line labels also don't seem to follow any consistent principle. (The VTA '22R' seems to refer to the 522, for example.)
Brian wrote a blog post about this map's future cousin, which directly extrapolates from current transit plans (unlike many fantasy transit maps). Streetsblog also writes about these maps; SPUR, the publisher of The Urbanist, even bills a present-day Bay Area-wide mobility map like this as one of six ideas for saving Bay Area transit.
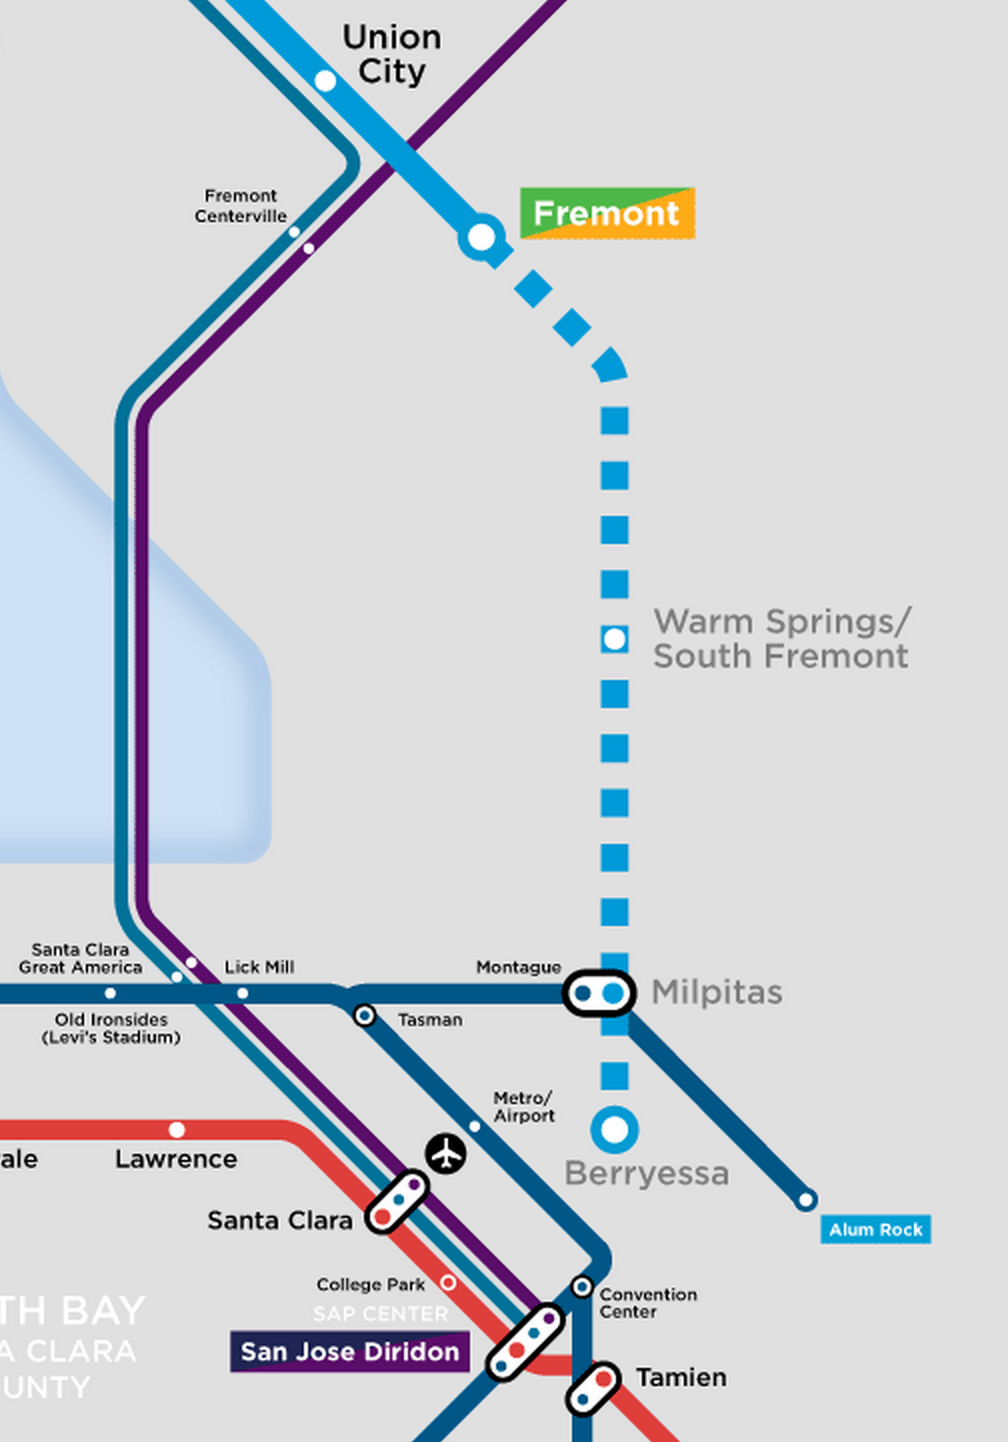
California Rail Map (Alfred Twu et al.)
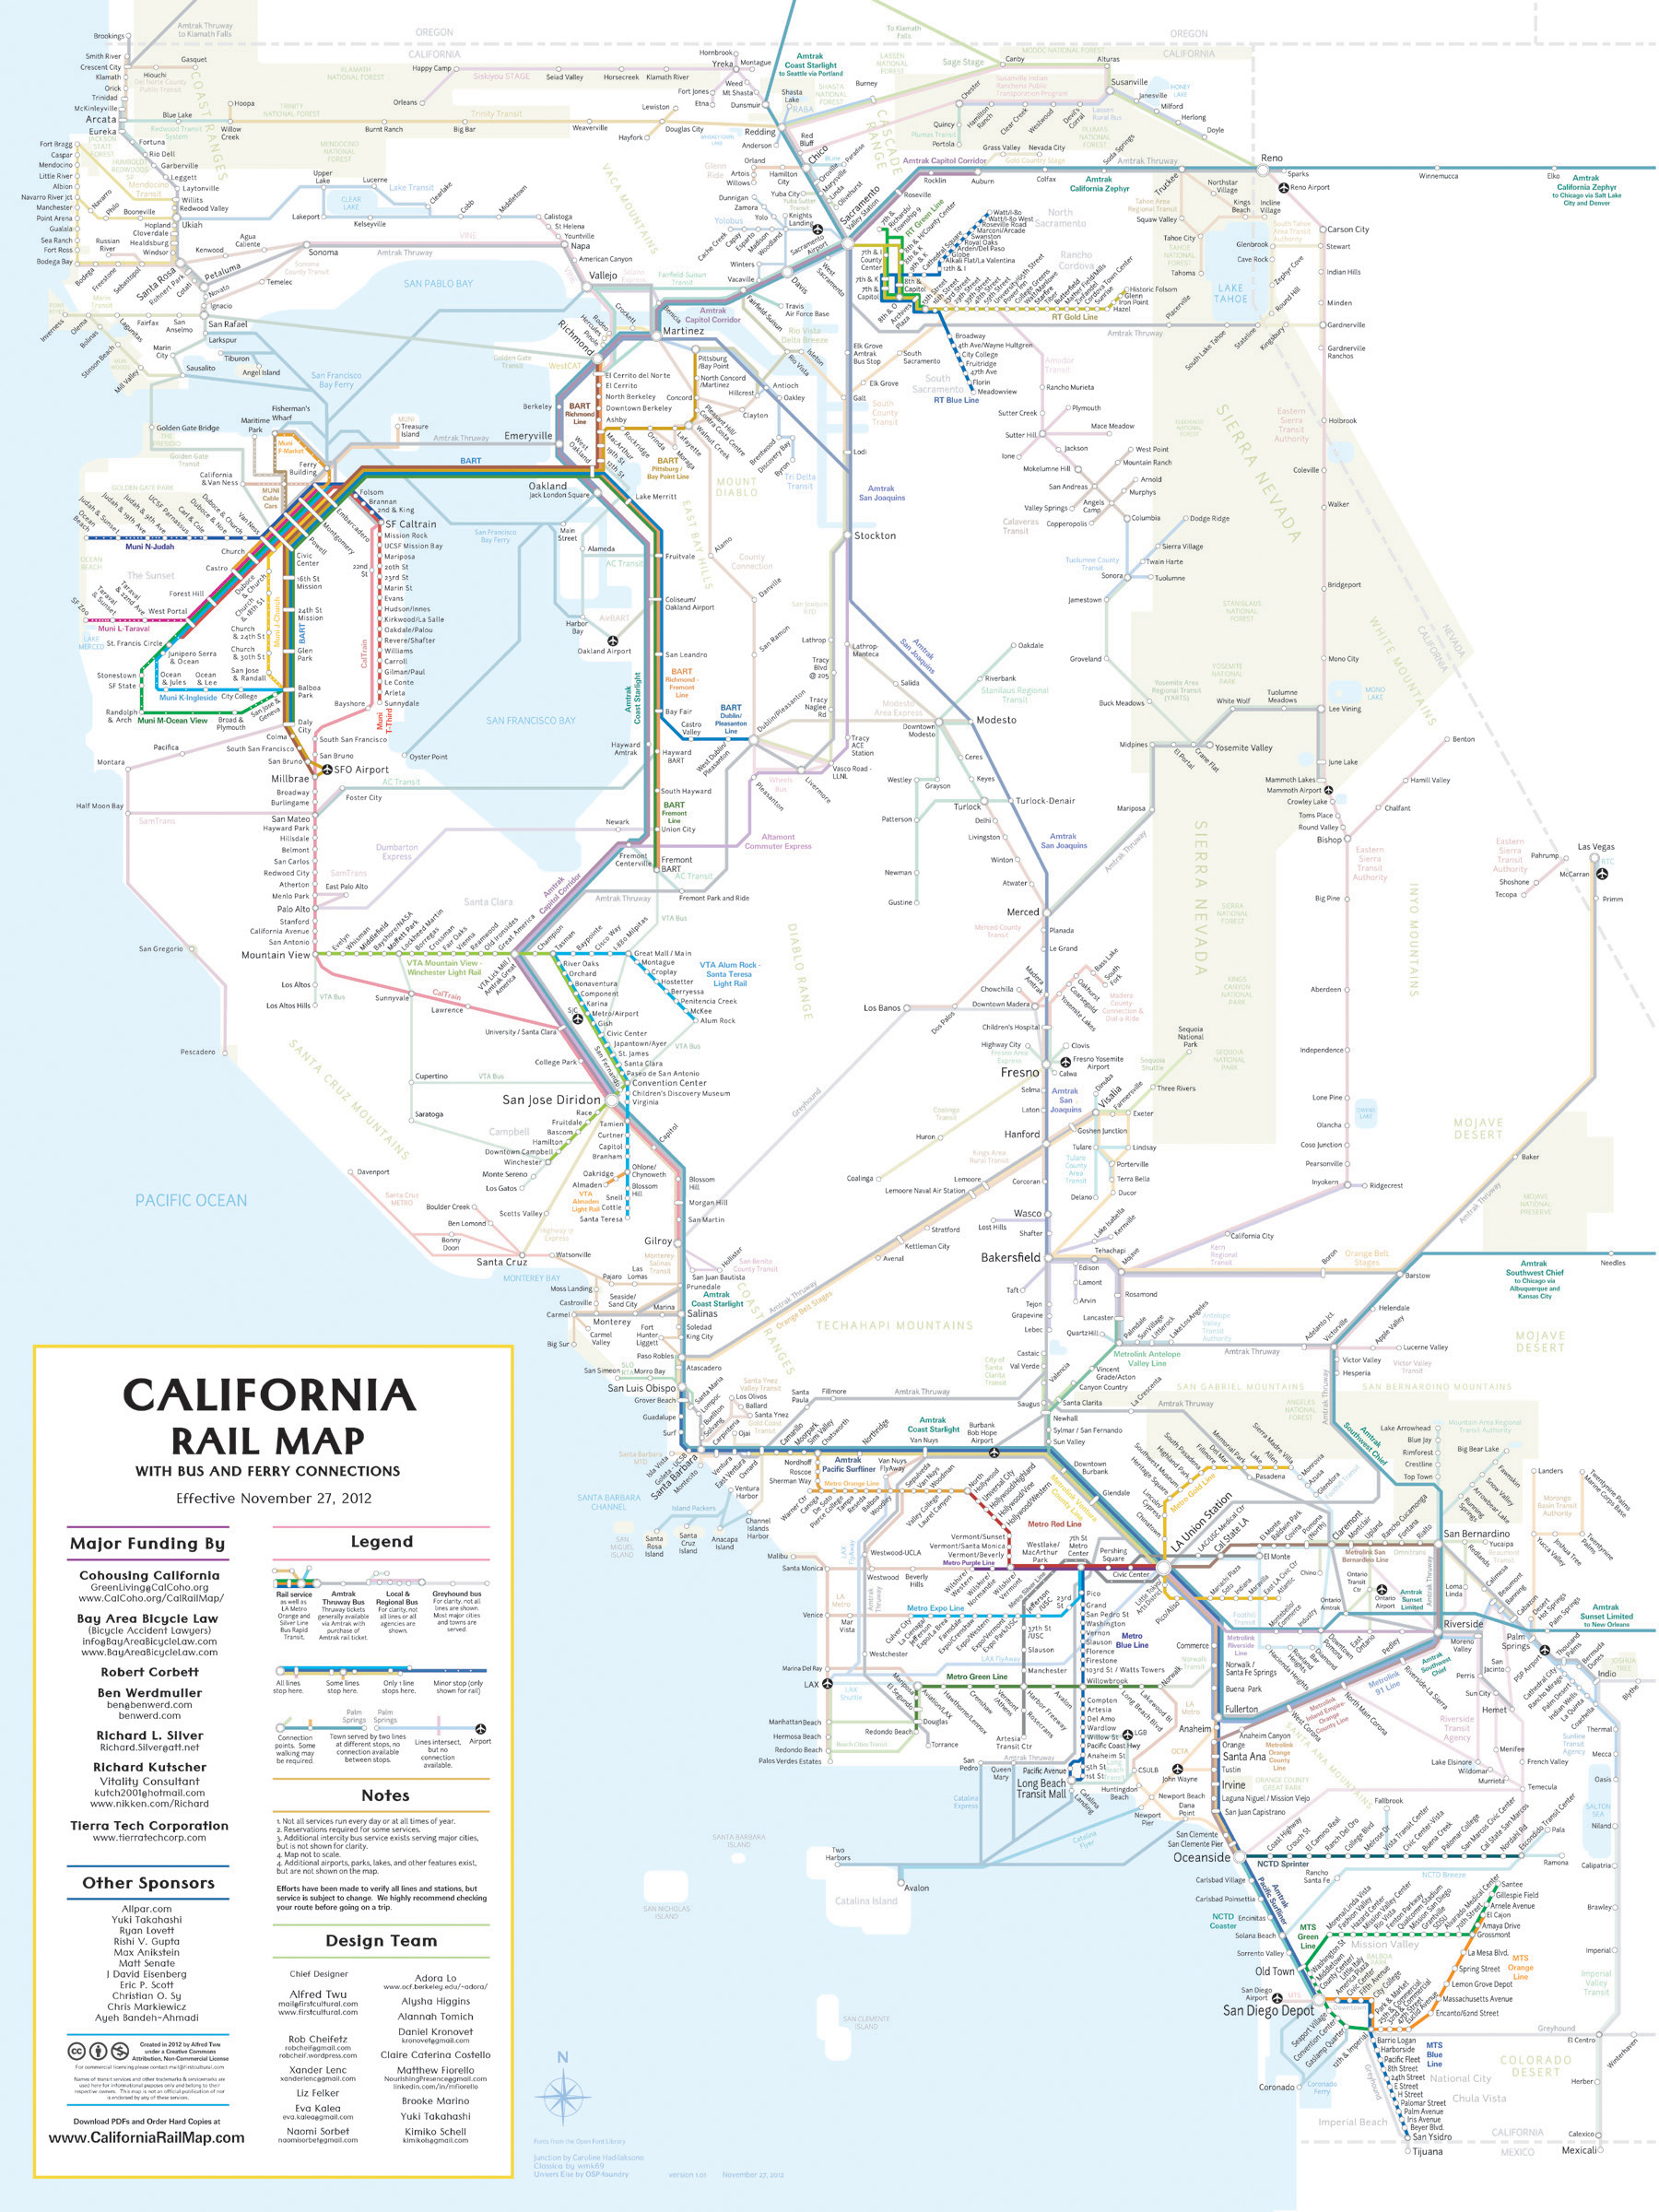
California Rail Map (enlarge) (original PDF at site)
This map, and its sibling the Northeast Rail Map (below), are good examples of the tradeoffs of this post. It's got a huge amount of information, encompassing dozens (hundreds?) of services, from Yolobus to Metrolink.
It's an amazing, ambitious work of data aggregation and design. I'm impressed at the sheer amount of research that must have gone into producing the map: finding transit agencies, downloading one-off PDF schedules, figuring out how close this rural bus stop is to this other light rail line, making sure all the pieces fit on the map. This map proves to you that Epic Transit Journeys' Los Angeles to San Francisco itinerary could actually work. (Or the reverse route, which even got a cover story in SF Weekly in 2011.)
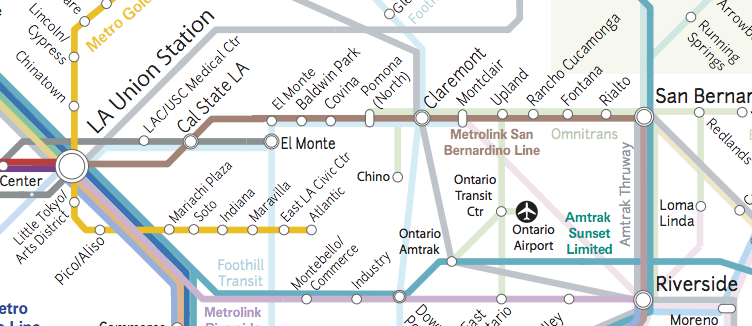
Lots of lines in Los Angeles
But the design is very much imperfect. The map joins transit lines at seemingly arbitrary angles; sometimes it uses a curve instead. Lines have all kinds of slopes.6 Labels have various font sizes, orientations, and distances from their corresponding stop markers.7 Stop markers are usually circles, but their sizes vary, and sometimes a stop stretches into an idiosyncratic little oval so that it can connect two lines.
I get the sense that the map was drawn piecemeal, as data was found and added, maybe by different people, with few overall standards for design and no overarching plan at all. It's not geographically accurate, but it also doesn't have the sense of order of a good diagrammatical map, where angles, labels, and curves follow certain standards.
To be fair, I'm not sure a geographical map would be practical here, and the designers undoubtedly worked under tough constraints to make a map that kind of resembles California while also fitting all these systems in.
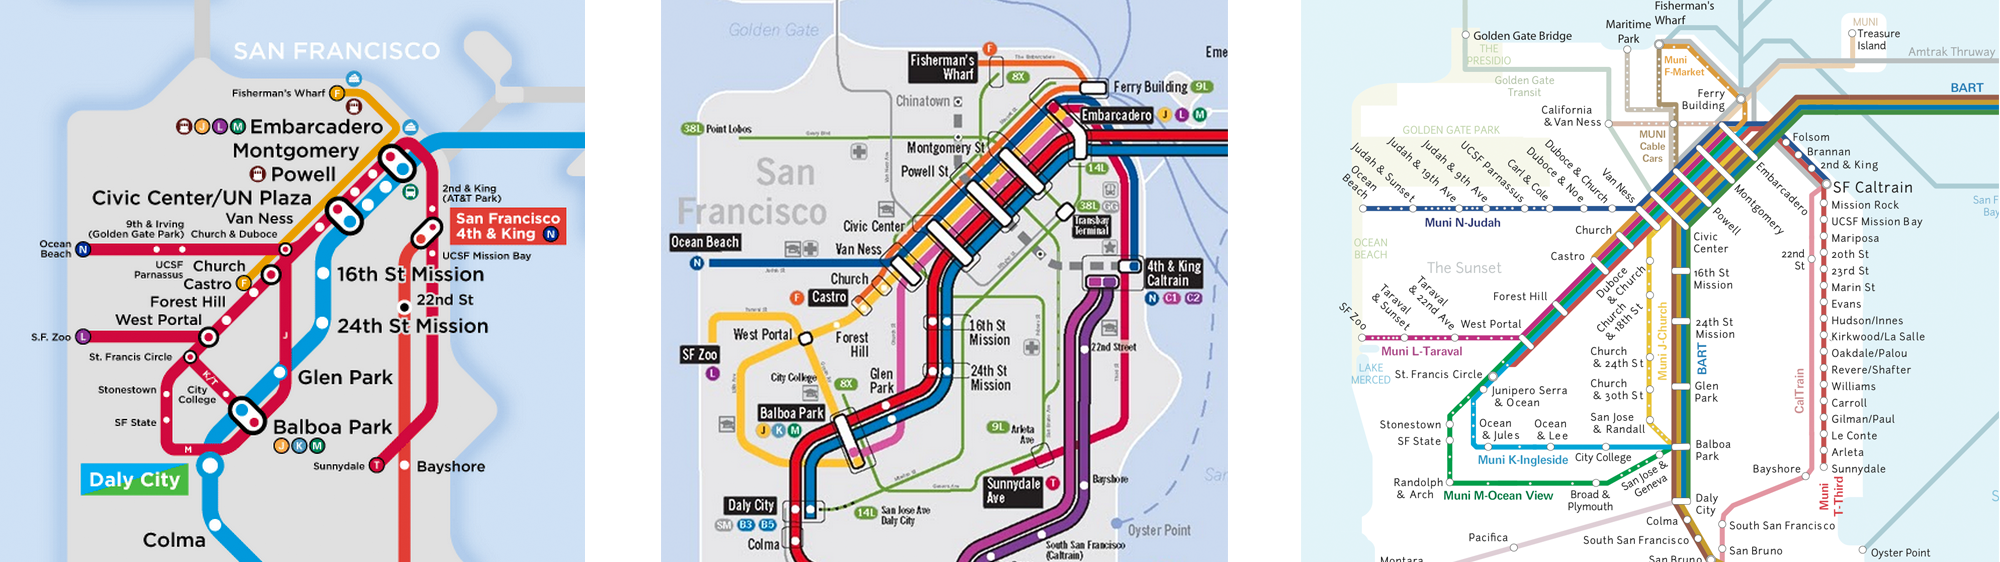
Comparison of the three maps' renderings of San Francisco (enlarge)
Greater New York Regional Rail (Jake Berman)
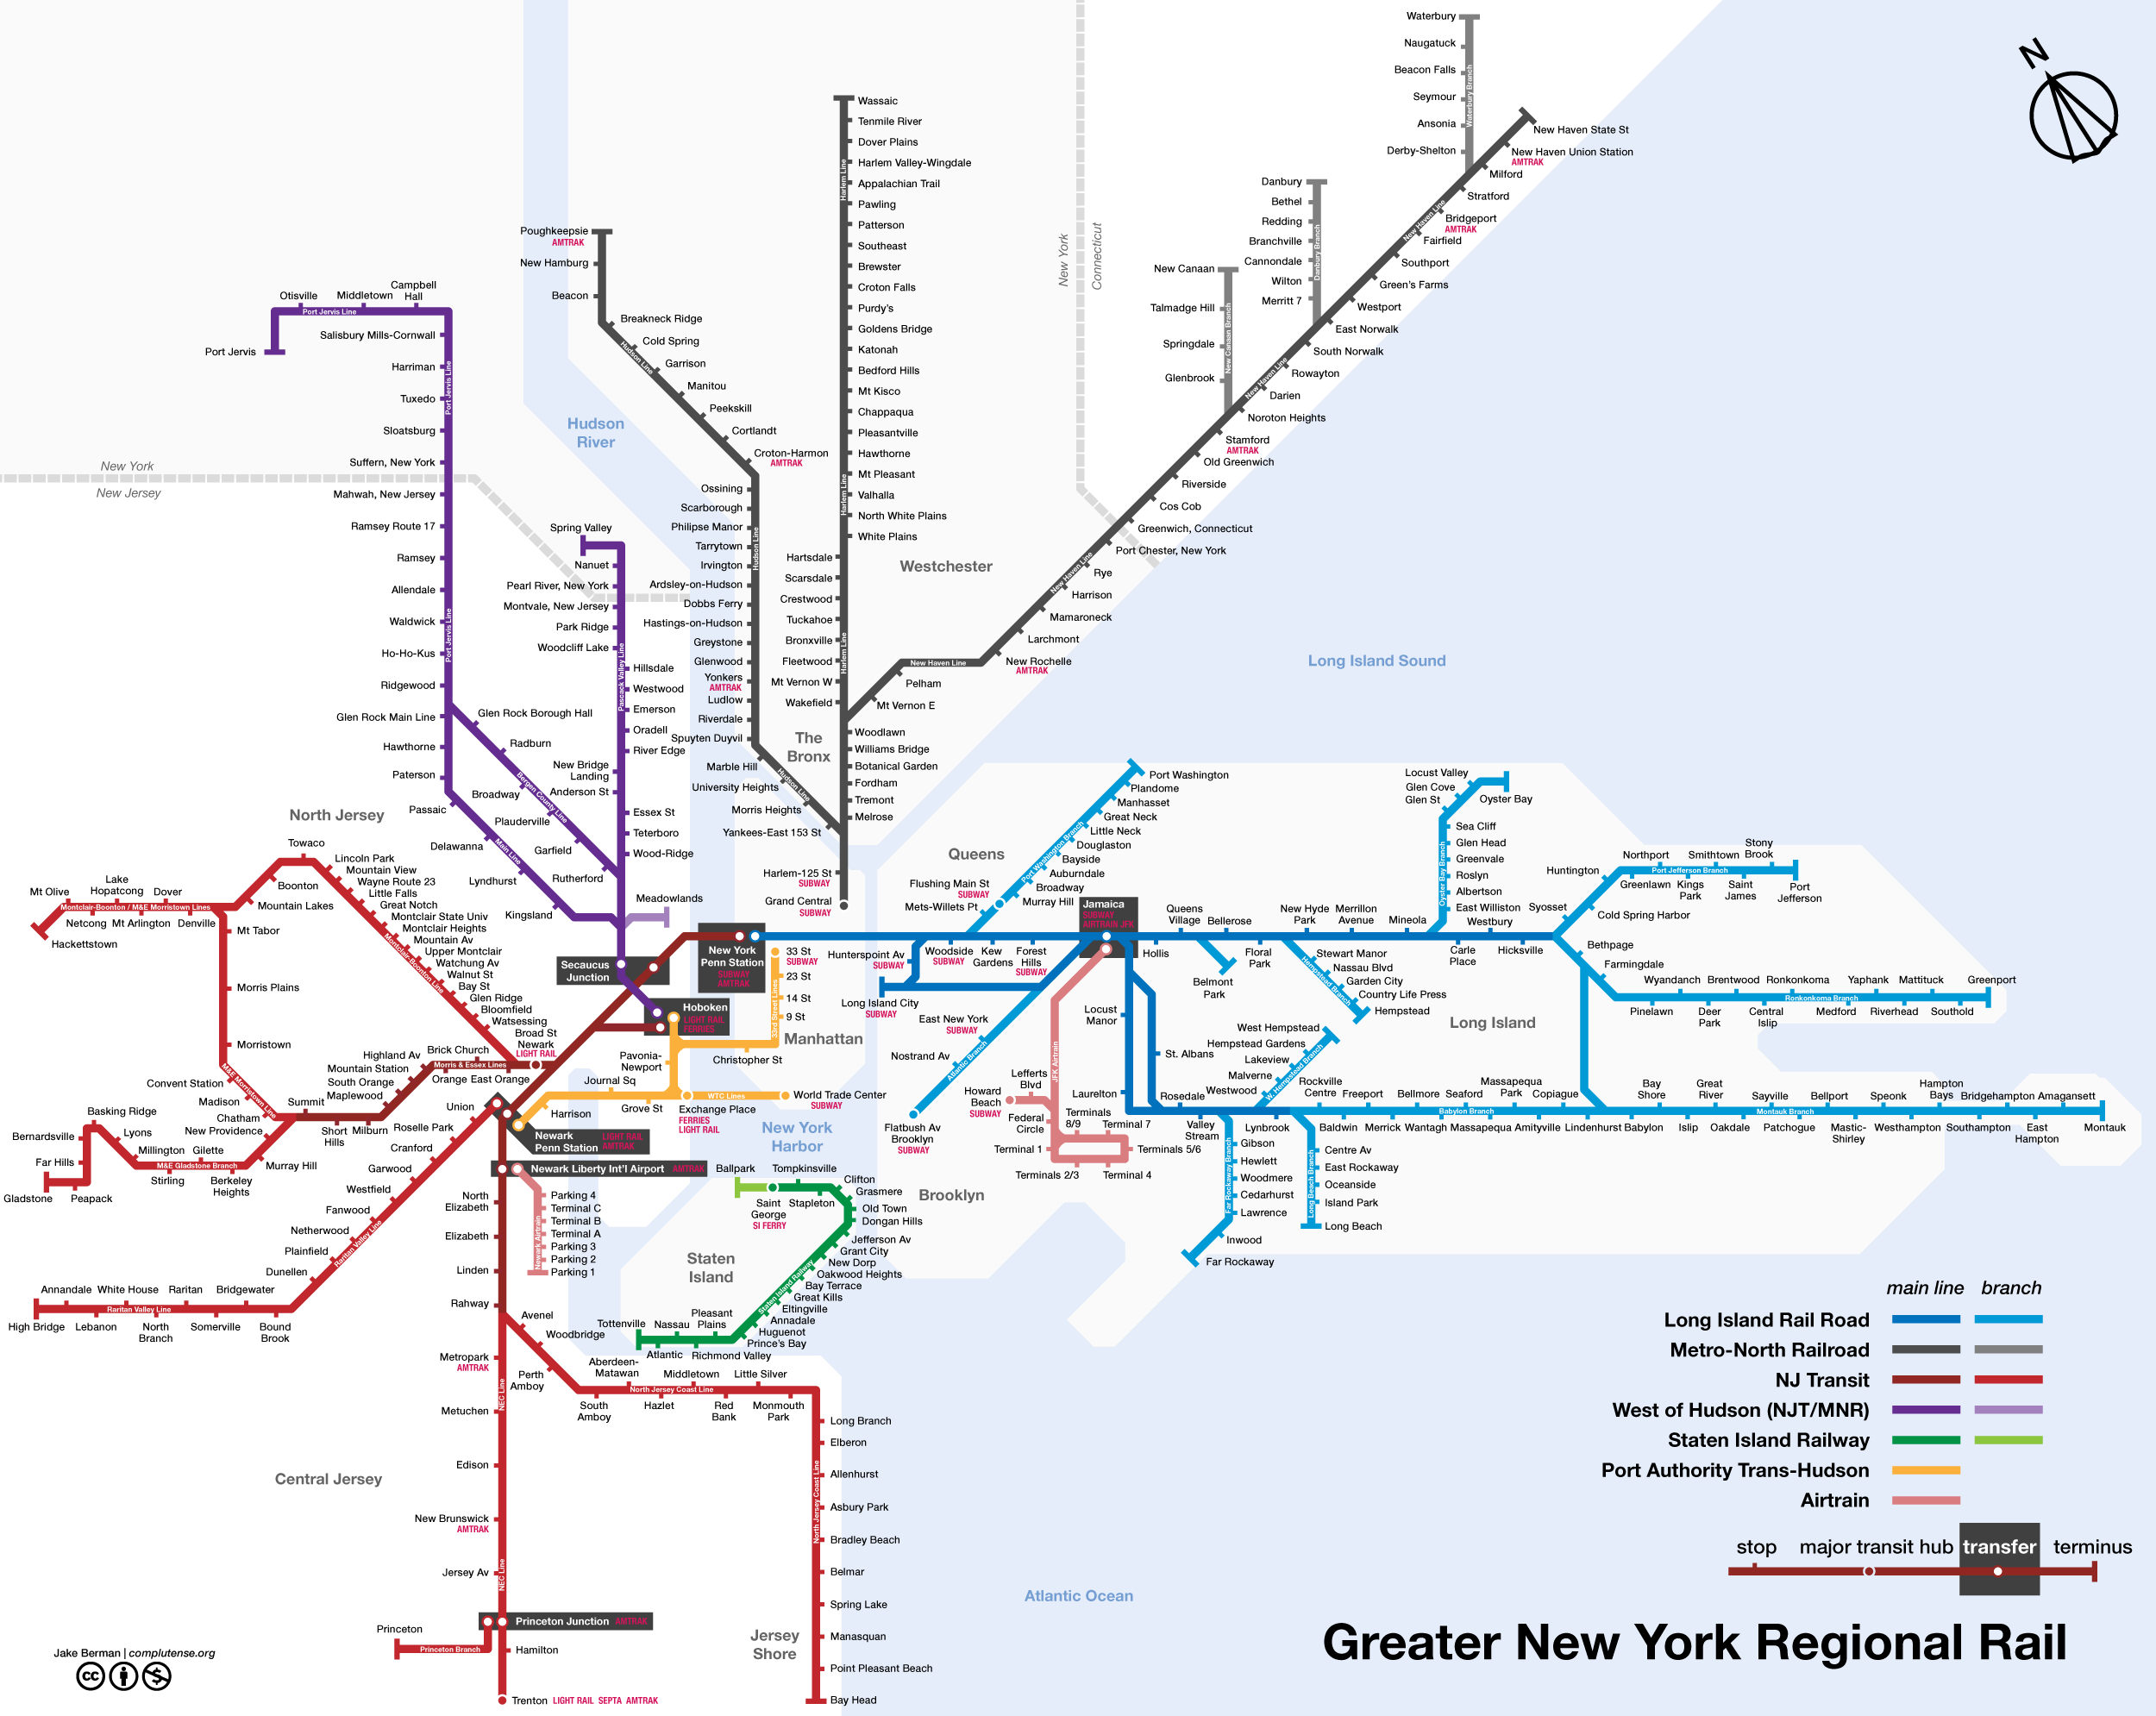
Greater New York Regional Rail (enlarge)
I like Jake's summary of the greater New York situation in his description of this map: "New York has no fewer than four different commuter rail agencies, none of which is willing to share maps."
Cam Booth has a review which covers the aesthetics of the map pretty well.
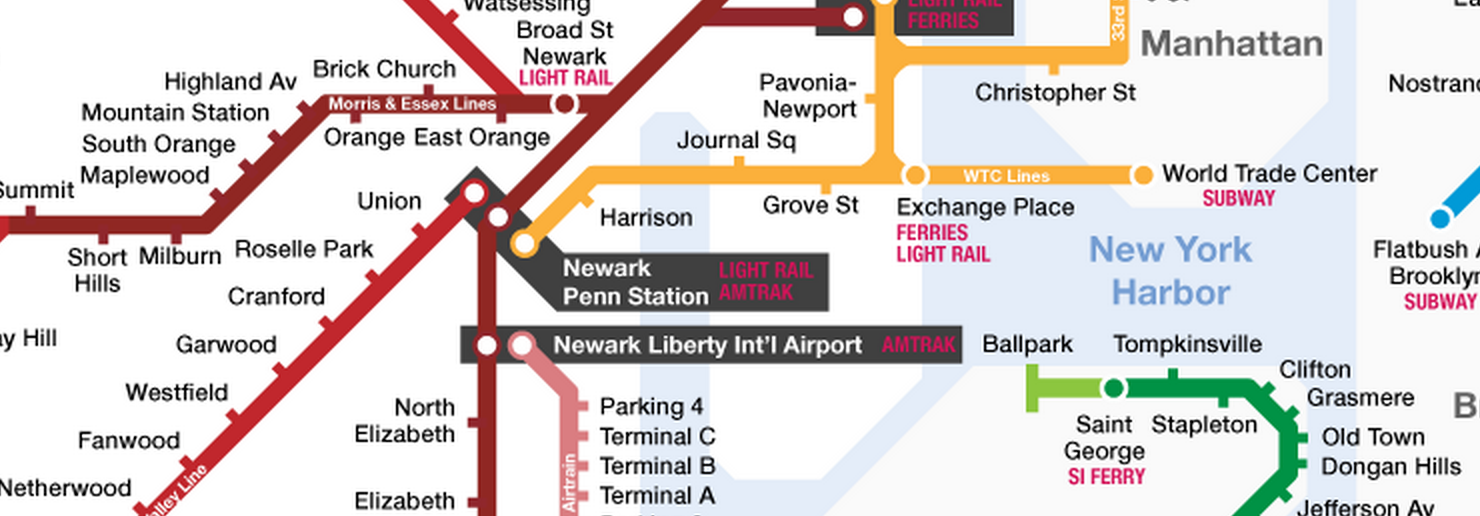
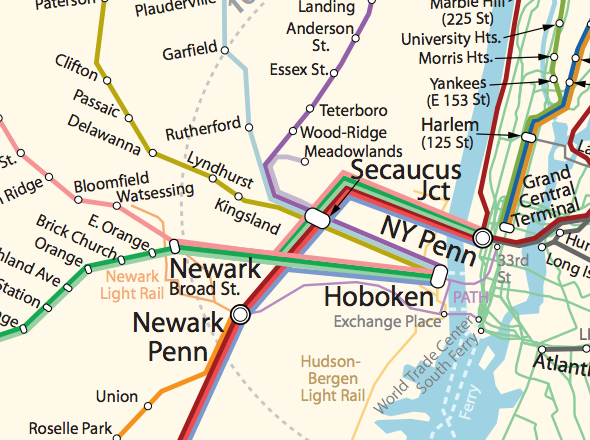
Excerpt of some of Manhattan and New Jersey from map
In particular, I agree with Cam that the New Jersey part of the map, especially the Morris & Essex/Montclair-Boonton Line section, looks cramped relative to the rest of the map. I also liked his callouts of major transfer stations with the gray background. That technique would be cool to see on Brian Stokle's Bay Area mobility map (seen earlier), which tried to use faint outlines to mark transfers.
Jake's use of notches rather than circles to show stations is also unique among the maps here, and it works well.
It's funny that this map actually seems to shrink Manhattan's importance, because it only has a few commuter stops, which are no bigger than any other stop (since the lines merge together); most of the network complexity appears in the suburbs.
Jake Berman's other work is available at his site studio complutense.
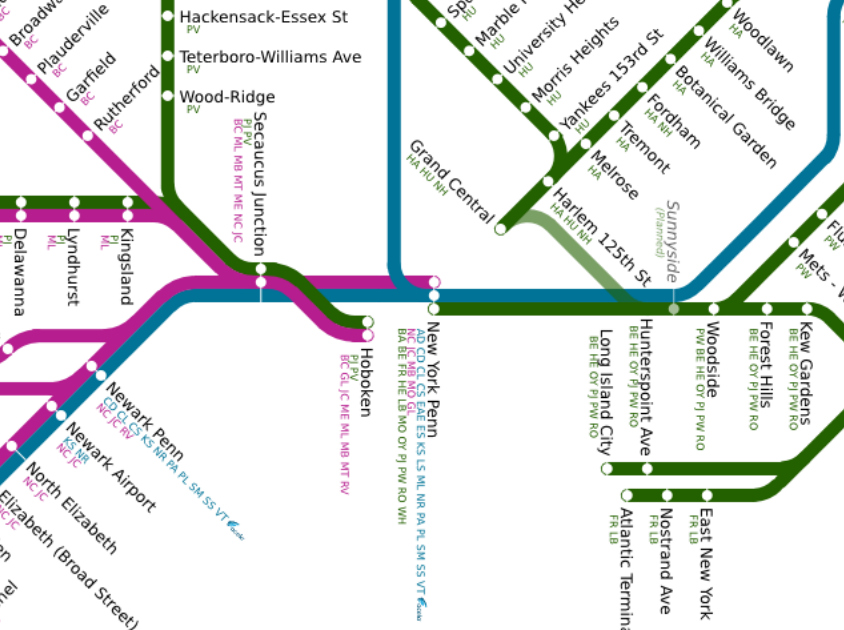
New York Regional Rail Diagram (Carter Green)
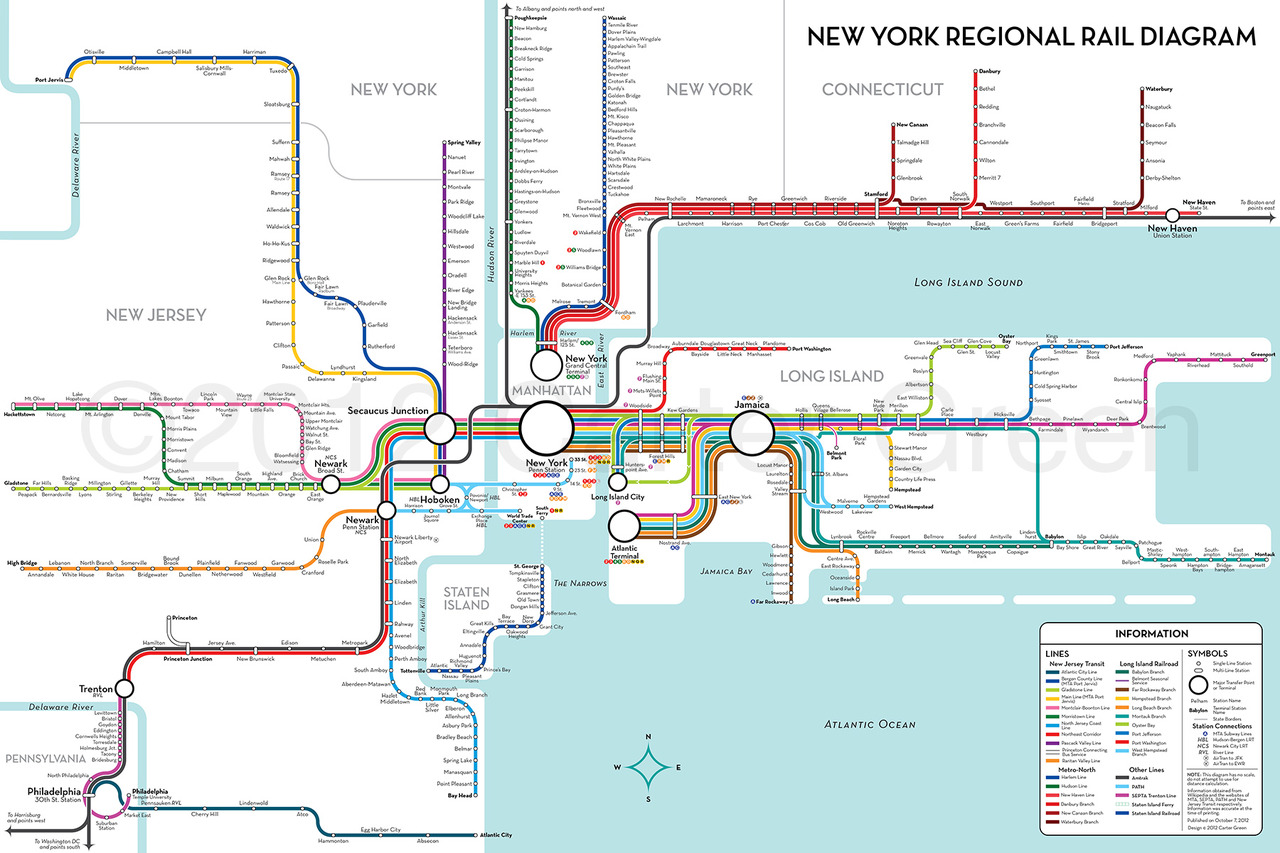
New York Regional Rail Diagram (enlarge)
Carter Green, a high school student, made this map in 2012. Cam Booth has a glowing review of this map on Transit Maps. I can't find a full-size version of this map anywhere, and neither could Reddit, unfortunately. (Let me know if you can find one!)
(One small correction: Suffern is on the wrong side of the New York/New Jersey state border here. It's in New York, as Jake Berman's map shows.)
This map is probably my favorite for design among all the ones here. It's got a distinctive, elegant style and conveys a lot of information in a consistent way. I love the graceful curling around as trains run through 30th Street Station in Philadelphia. It's just a joy to read (if only we could see it at full size!).
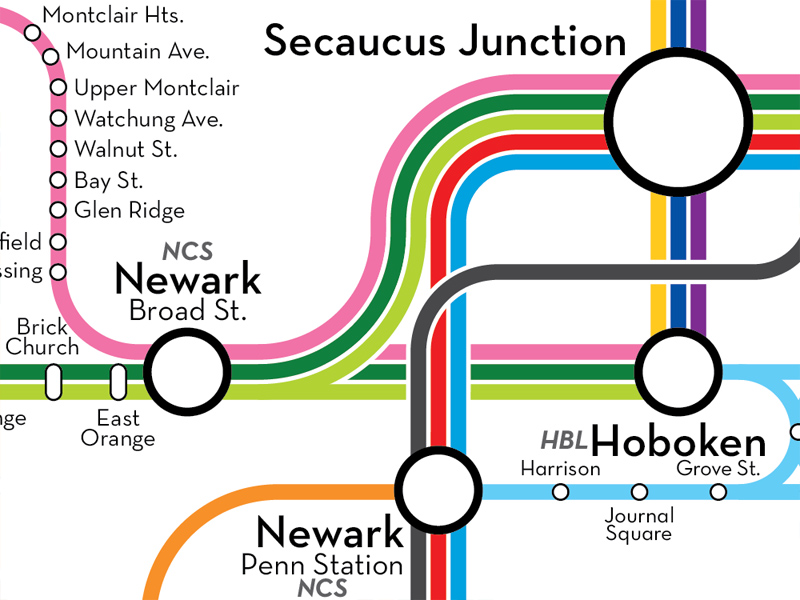
Excerpt of Secaucus/Hoboken/Newark region
Unlike the two Bay Area maps, this map and the previous map contain almost exactly the same information, so we can do a direct comparison. I think this map is nicer to look at than the previous one, and it tells you a little bit more (service frequency by the number of branches running through each station). I also appreciate the inclusion of Philadelphia and some SEPTA connections.
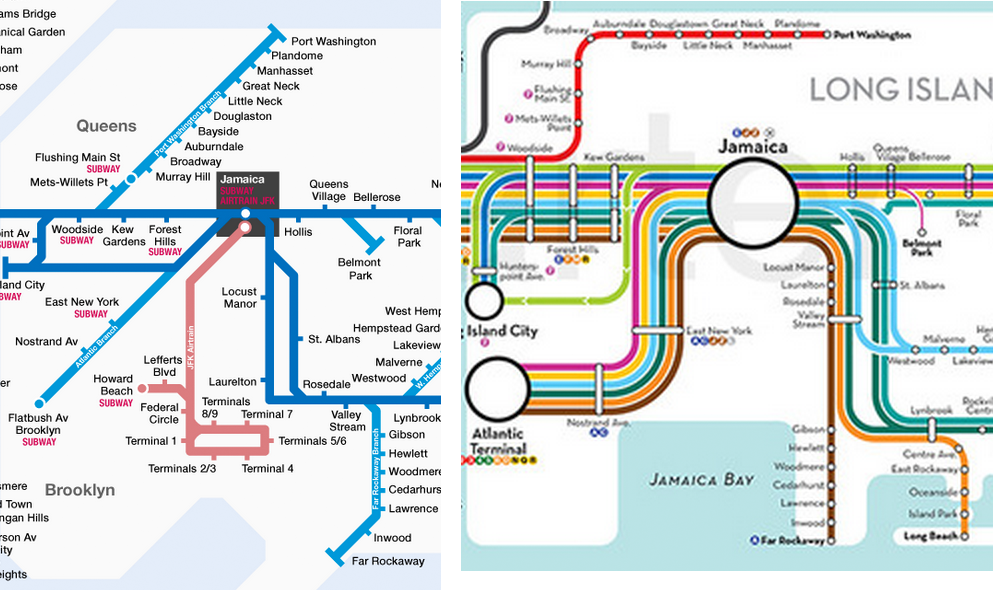
Comparing Jamaica in the Jake Berman and Carter Green maps (enlarge)
Notice that we don't see any buses in either map, even though an expansive network of private and public express buses runs between Manhattan and suburban northern New Jersey, Long Island, Westchester, and Connecticut. In fact, I've never seen a comprehensive map of those commuter buses, even just for buses from one company; for example, Coach USA only seems to publish maps of individual routes.
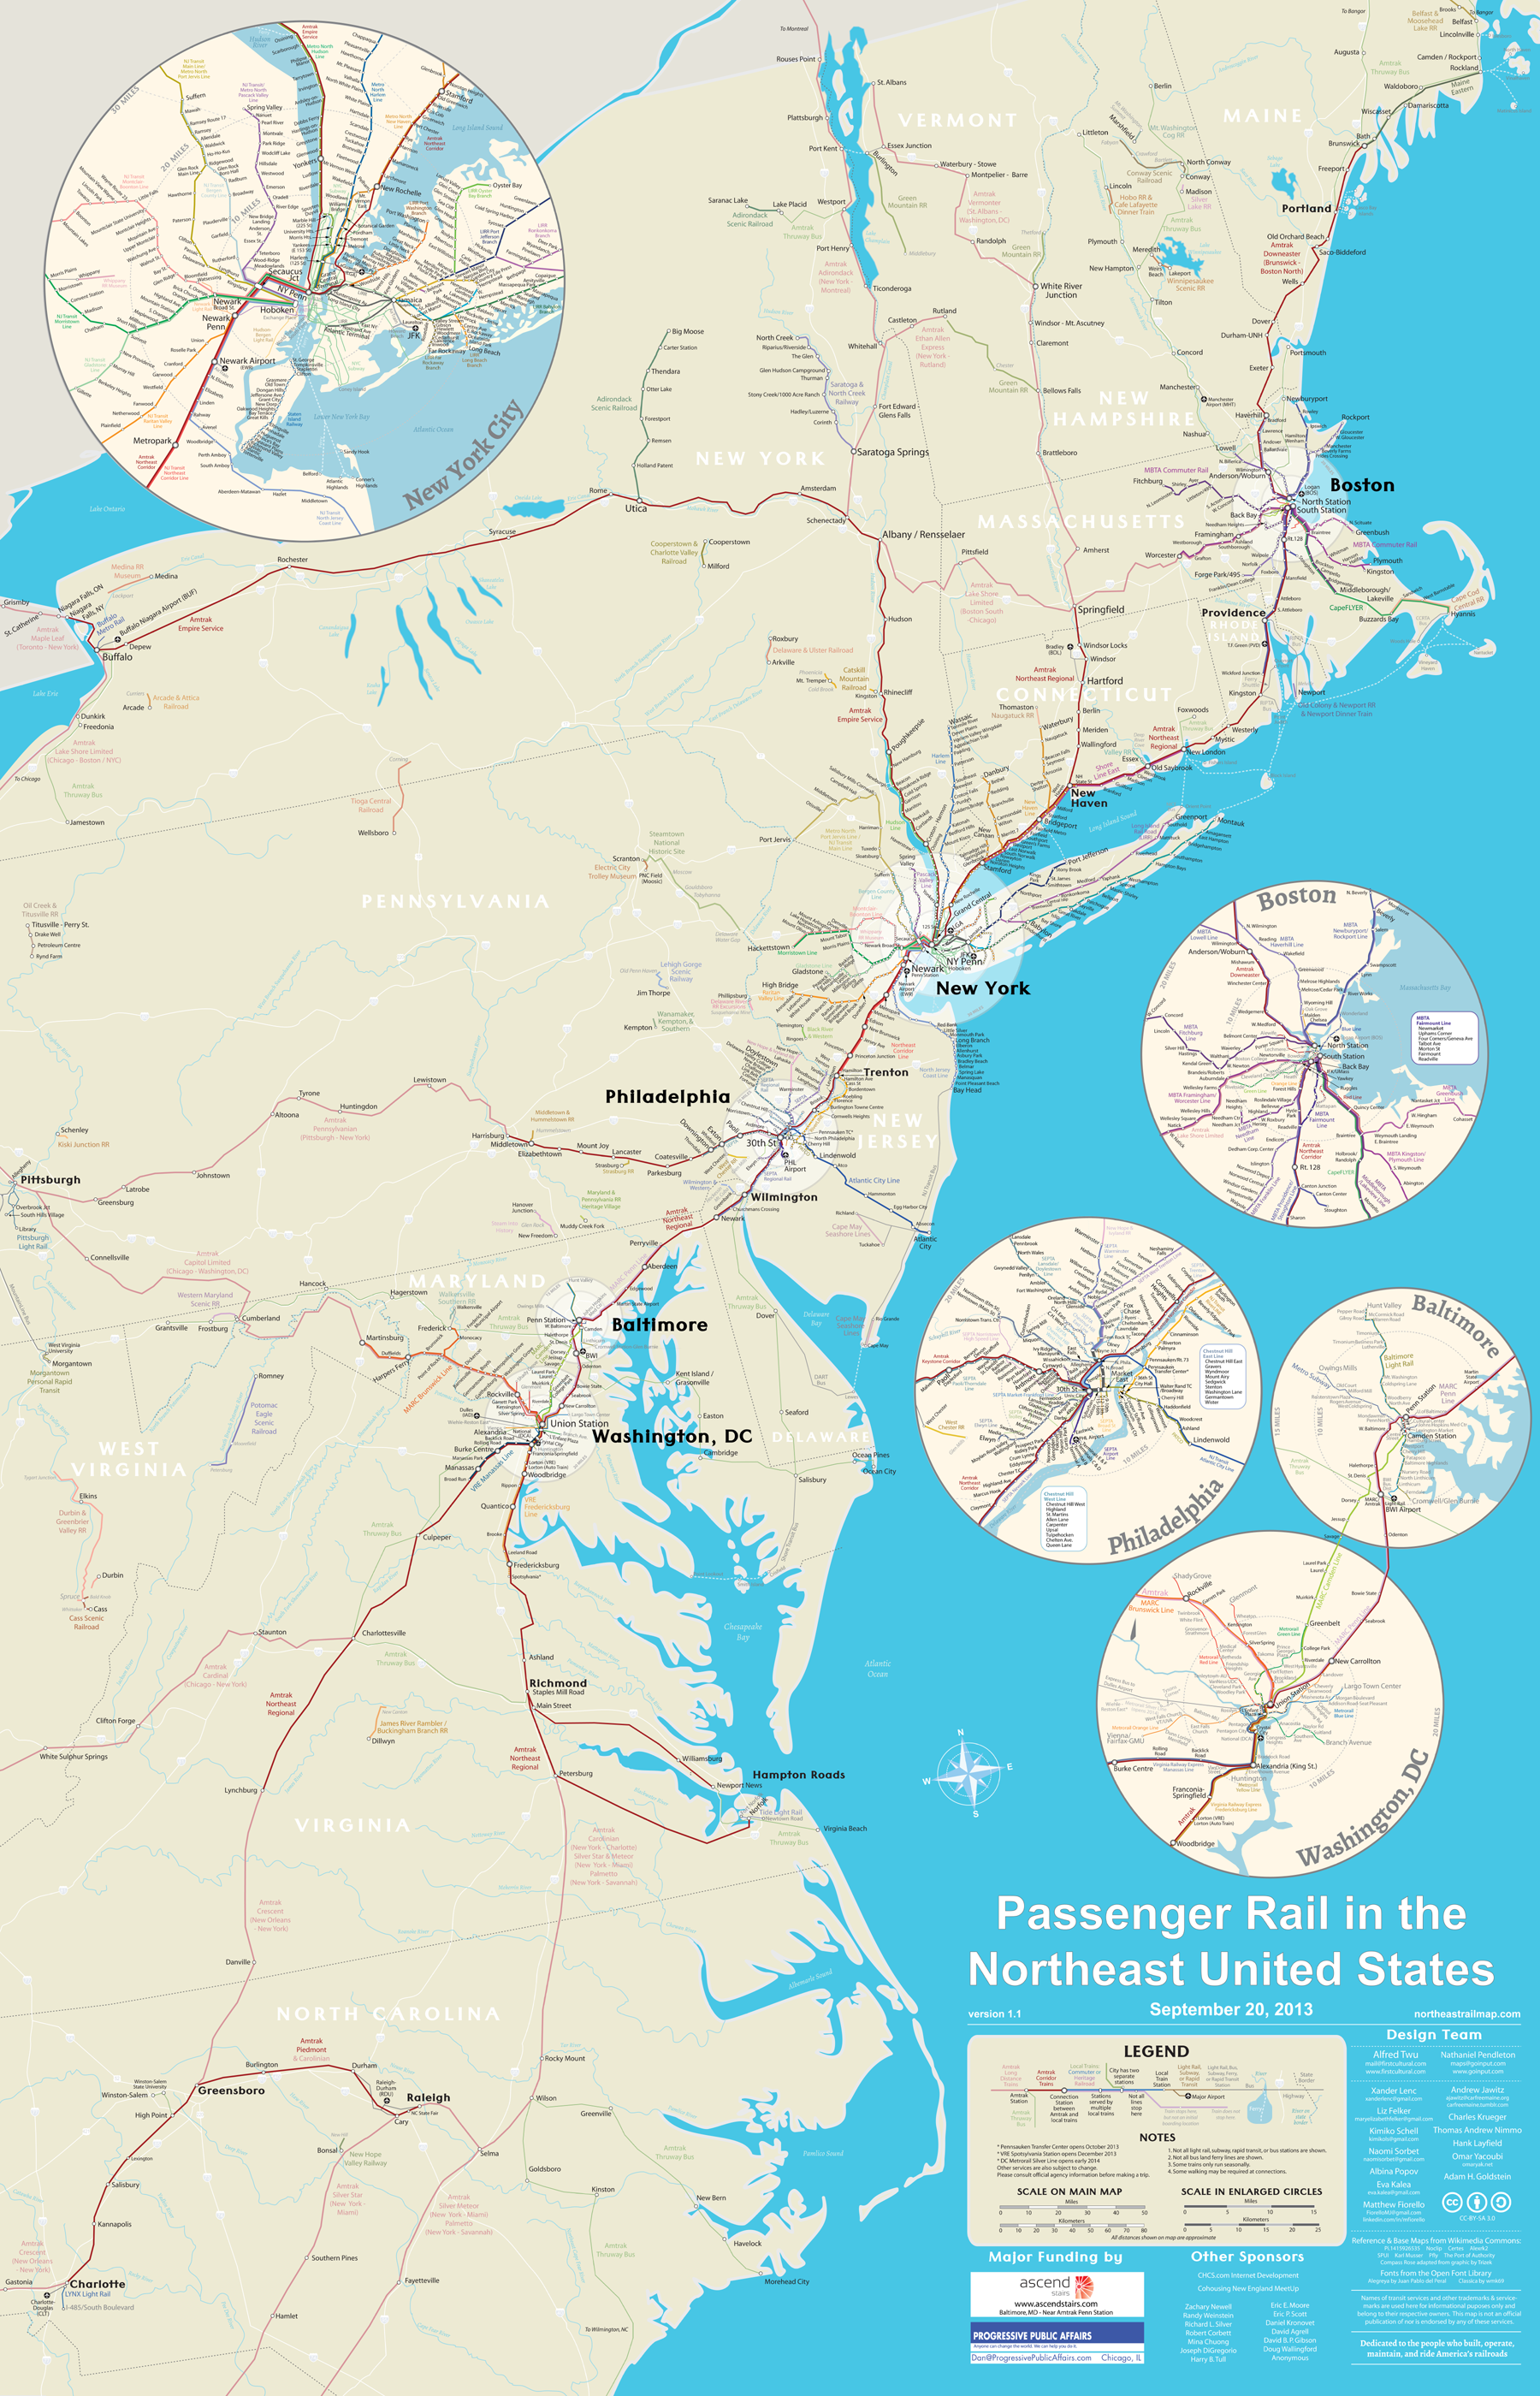
Northeast Rail Map (Alfred Twu et al.)
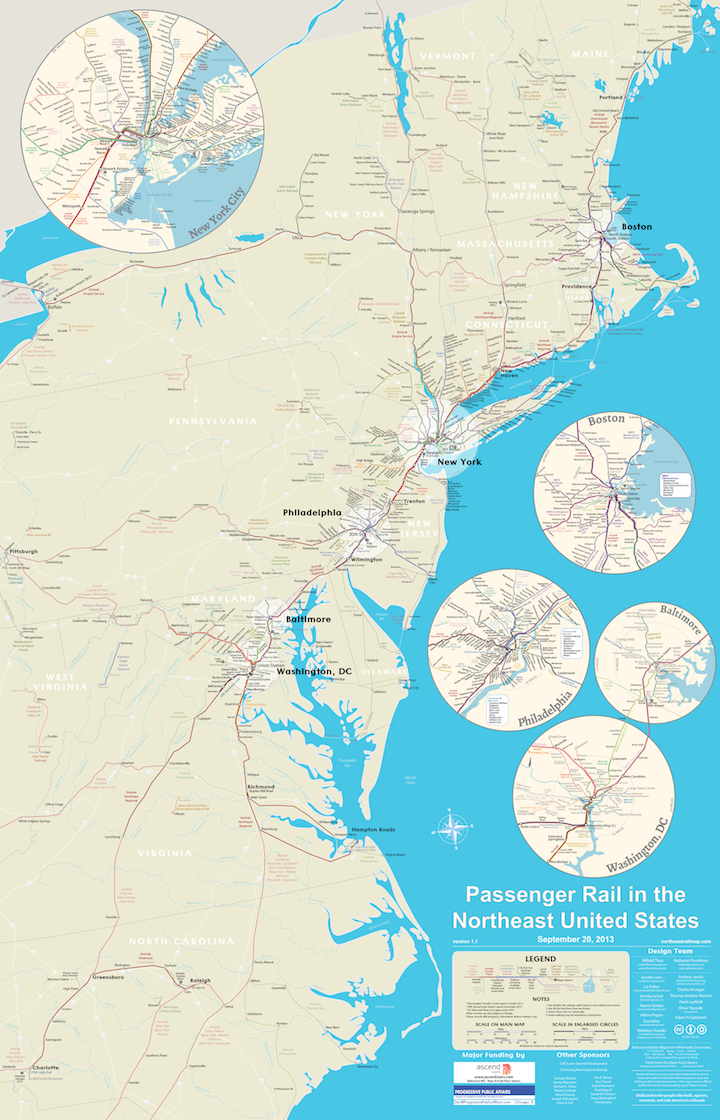
Northeast Rail Map (enlarge) (original PDF at site)
It's interesting that the Northeast Rail Map is so geographical compared to the more abstract California Rail Map,8 even though the two maps mostly had the same design team. Just look: the California map is entirely straight lines joined at angles, and the Northeast map has almost no straight lines at all.
Northeast Rail Map lines vs. California Rail Map lines
My intuitive feeling is that the California map does a better job of showing connections and network design, and it doesn't waste as much space on uncovered land as the Northeast map. The Northeast map leaves my brain with an impression of the geography of railroads and the coastline, but that's not really what I'm looking for. I'm less interested in the precise distance between Richmond and Selma and more interested in how many ways I can get from one to the other to a third place.
Newark, Secaucus, and Hoboken in the Northeast Rail Map
The insets for major metropolitan areas are a good touch, and probably necessary to make commuter lines legible while preserving geographical accuracy.
Overall, this map seems to emphasize physical rails more than the California map, which shows you networks.9 I'm once again impressed by the meticulous research of Alfred and his team, although I think information on railroads is easier to come by than the information on rural bus systems in the California map.
Transit map of eastern North America (Edward Powell)
Transit map of eastern North America (enlarge at deviantART)
One of my favorite regional maps, and the map that inspired this post. Cameron Booth has a review on Transit Maps of the map's design. It's a nice, solid diagram. The map only covers commmuter rail, but it covers those services very well.
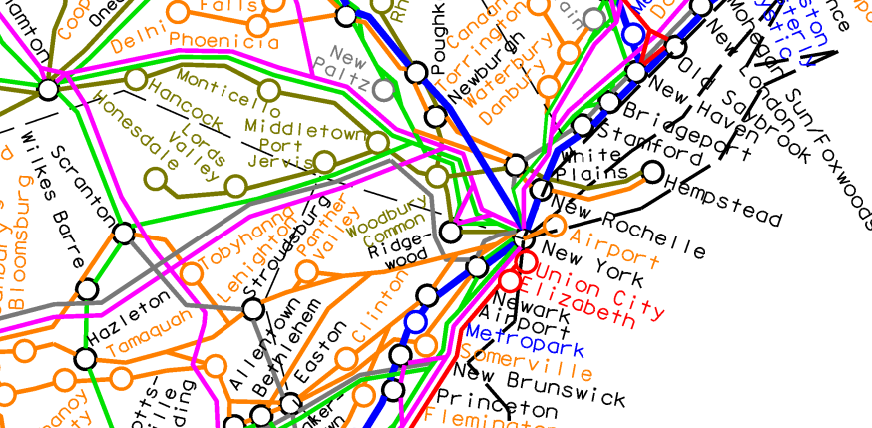
The center of New York's vast radial commuter rail network
Looking at this map gives you a clear picture of how big these commuter systems are (especially those in New York, which has three huge, independently operating agencies). For transit journeyers, it highlights the gaps on the Northeast Corridor between New London and Wickford Junction and between Newark, DE and Perryville.
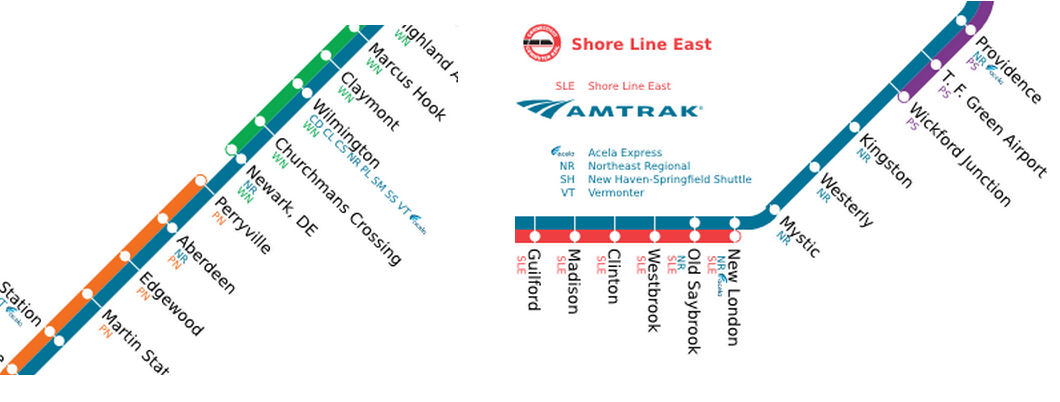
Gaps on the Northeast rail corridor that only Amtrak bridges
Now we can compare the greater New York area as seen in the past four maps!
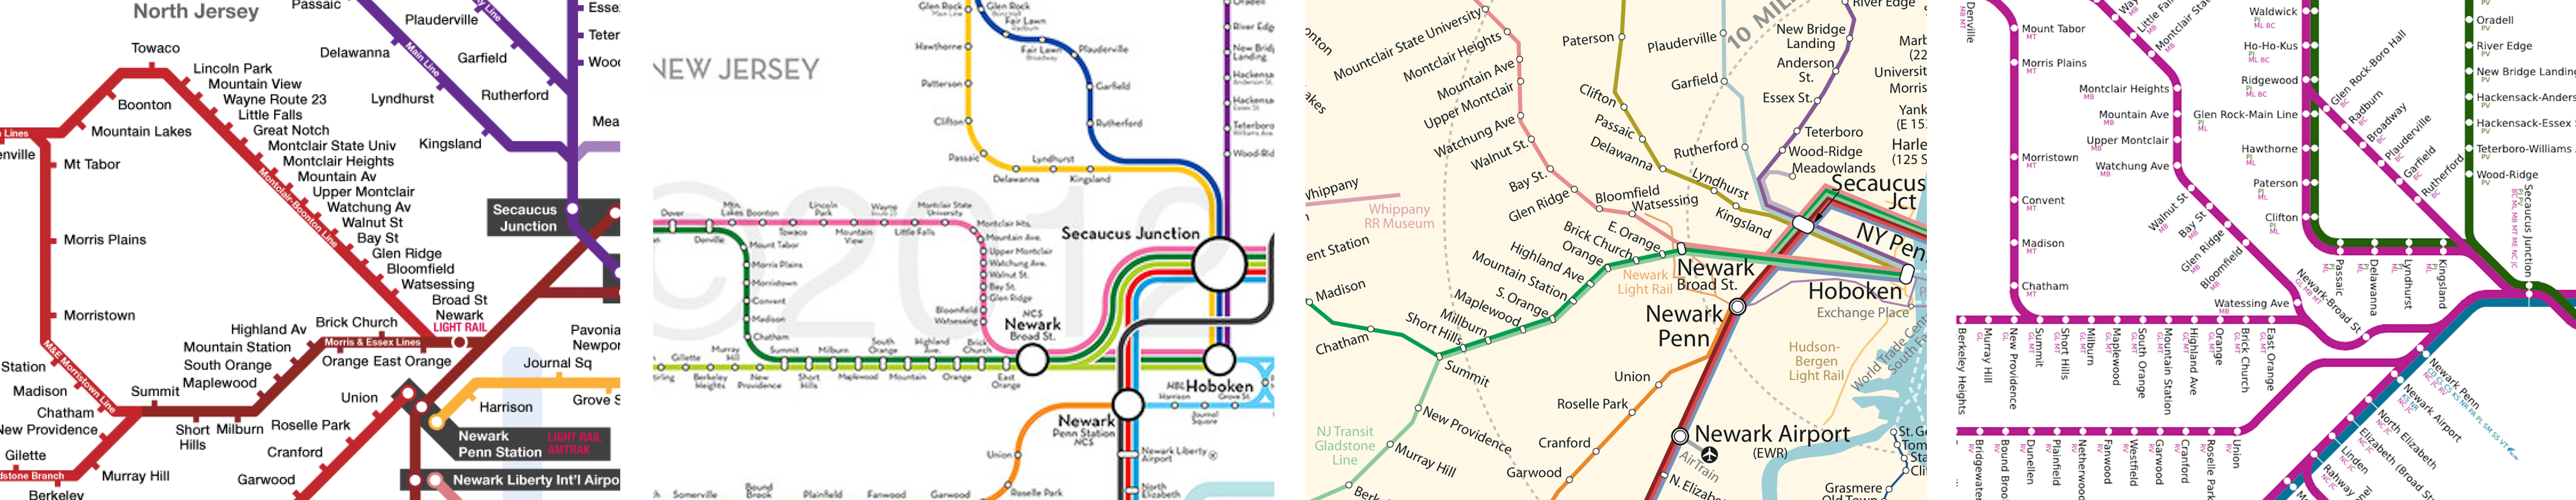
Newark and suburbs in four different maps (enlarge)
AIBRA U.S. intercity map (AIBRA)
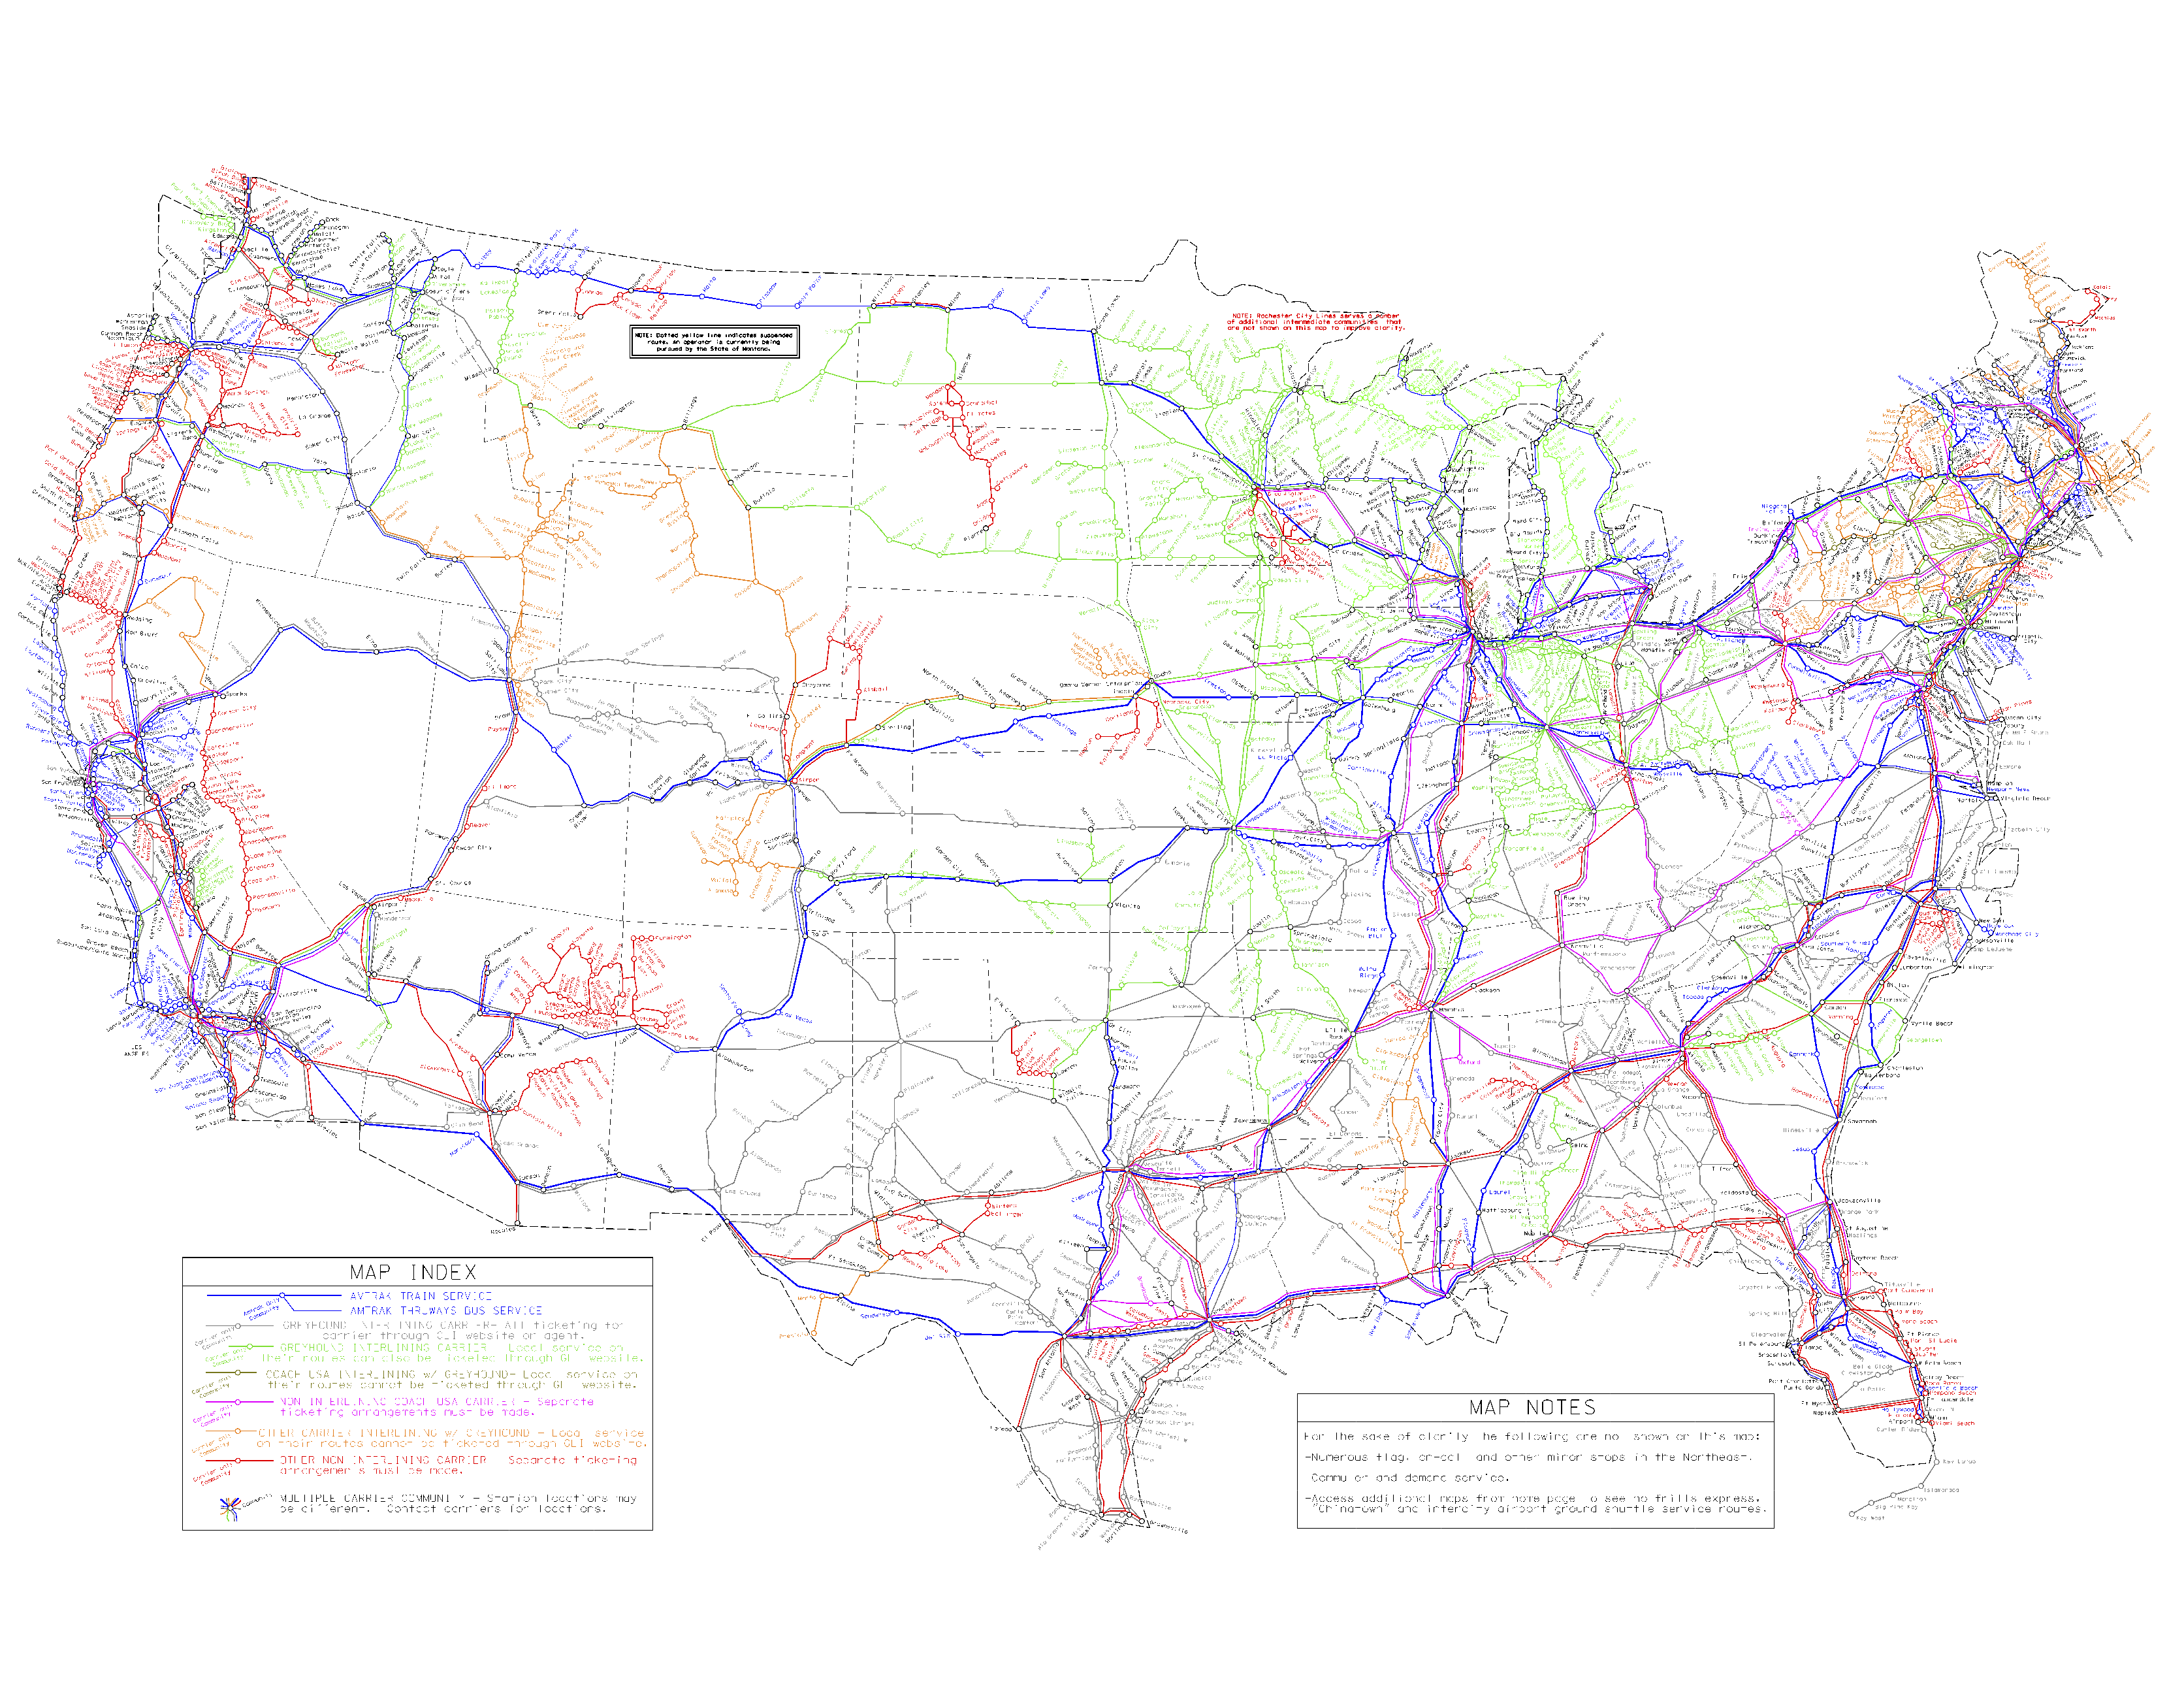
AIBRA U.S. intercity map (enlarge at AIBRA)
Unfortunately, AIBRA's intercity map is on the extreme end of the tradeoff I posited. It's basically unreadable10 in thickly populated areas, but it has information you literally can't get outside the American Intercity Bus Riders Association (AIBRA) site. AIBRA has data on private bus carriers in every city in the United States; you can look up almost any city and find out how to get in and out by bus. These buses can be Chinatown buses, airport shuttle buses, or other services with no website or public Internet presence at all. Sometimes the entry for a carrier just gives you a phone number. Google Maps doesn't touch this stuff.
New York City in AIBRA's map
It covers Amtrak lines, but doesn't cover other public rail or bus services like Caltrain or NJ Transit, so it's an outlier in this collection. It also doesn't tell you a lot about a bus line unless it's a Greyhound line, since buses around the country have the same color, but given how many different bus lines there are, that's probably excusable.
The Greater Greater Washington blog posted about this map a few months ago, and I decided to include it because I liked their framing ("everywhere you can get on transit"). AIBRA also has a collection of intercity maps for different regions of the country. All of them have the same style.
Honorable mentions
I've seen a few cool maps that don't really qualify, but deserve mention here.
Cameron Booth's subway-style map of Amtrak passenger rail services (direct link to full-size) only covers one agency, Amtrak, which has its own maps at that scale, but he does it so well that it's worth looking at anyway if you want a sense of transit in the United States. He has a similar map for France's high-speed train routes.
Joseph Brennan's site has some really interesting work. His masterwork is a metro-area map of New York City and some suburbs, mainly emphasizing subway and light rail routes. More relevant for this post is his Northeast Corridor Project; he created a timetable including all trains anywhere on the Northeast Corridor, from all agencies (MBTA in Boston, Metro-North in New York, VRE in Washington...), between Richmond and Portland, ME, at historical points from 1893 to 2008. That unified timetable is well in line with the spirit of this post, and the historical data is an added bonus.
Javier Martínez Cuevas at CityRailTransit has some excellent to-scale maps of urban areas around the world. Check out his New York City/Jersey City/Newark, his San Francisco, and his San Jose. They're near-impossible to find on Google, so bookmark them if you like them!
Conclusions
-
These sorts of maps could make transit trips like the New York to Boston one, or San Francisco to Los Angeles, much easier; I'd like to see more similar maps. I'm also curious about what you can do with interactivity and software design, since you probably can't fit all the information needed to make such a trip on a single printable map. The best interactive maps I've seen have been part of things like New York Times features; they aren't maps for wayfinding.
-
The maps (besides the AIBRA map) mostly focus on public rail lines. People seem to associate trains with good service in the U.S., both for actual quality and for class reasons (the 'bus stigma').11 Besides the AIBRA map, they also, maybe unconsciously following the transit agencies' lead, exclude private services like Greyhound, BoltBus, Peter Pan, and MegaBus. (For smaller-scale metro area maps, you could include private jitneys/dollar vans.)
- The variables these maps display are telling: distance, transportation technology, government agency or bus operator. I'd like to see these maps talk about frequency. A heritage train that runs once a week should not get the same billing as a city bus that runs every five minutes. I agree with Jarrett Walker that people, and thus their maps, too often prioritize travel speed and transit technology over equally important information about frequency and span.12 Could we make a frequent-network regional map, or at least show this information some other way, like making line width proportional to frequency?
- As I said earlier, it looks like the more ambitious the map is, the worse the design is. Maybe having more information encourages you to compromise on design so that you can cram it in. Maybe some people spend time on design, whereas others allocate that time to data gathering. If that's true, then maybe we can make a beautiful map with ambitious scope, if we allocate more resources. (If not, maybe we can use technology to make one 'map-like artifact' that suits many purposes.)
Reach out to me! I'd love to hear your thoughts about transit, transit networks, cities, visualization design, and maps. I sometimes tweet about this stuff at @rsnous.
-
Just as apps like Google Maps and Transit decouple trip planning and timetables from the transit agency, perhaps we should decouple mapmaking from the agency, especially now that many of us primarily interact with maps through software. ↩︎
-
Or the ultimate floor tile game—how far can you get without hopping into a car? ↩︎
-
Chicagoland and the Midwest generally might also support a similar map, but I don't know much about the region. ↩︎
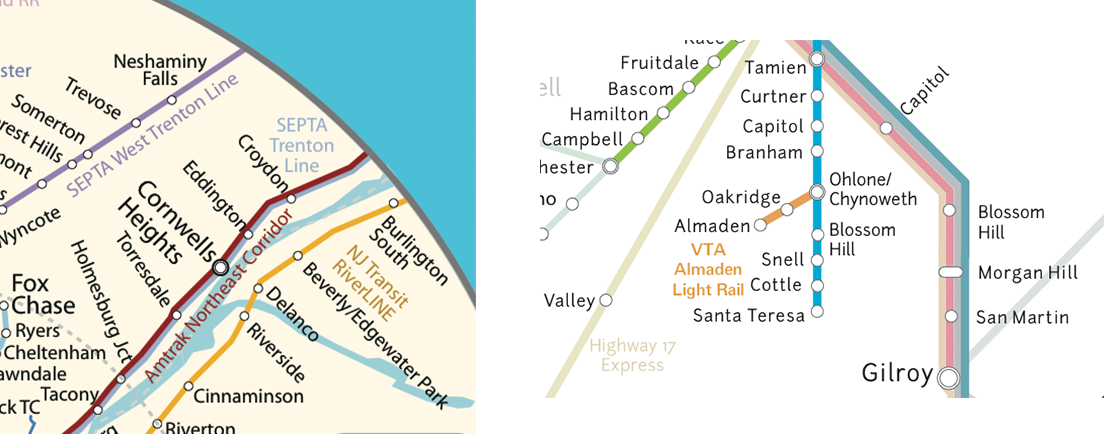
-
Although I concede that buses aren't part of the intended coverage of the map, I think that's a mistake! Someone interested in rail transit and living in San Jose would, for instance, want to know about the [VTA 181 bus](http://www.vta.org/routes/rt181) that stands in for the planned BART extension between Fremont and San Jose (which *is* included in the map, shown in the excerpt below).
↩︎
-
KickMap and Massimo Vignelli's subway map (there's a modern Weekender version) are alternatives to the MTA's official New York City Subway map which similarly show express lines and lines with different destinations as literally separate, even when they're on the same physical track. ↩︎
-
Look at the pictured area between LA Union Station and Riverside! ↩︎
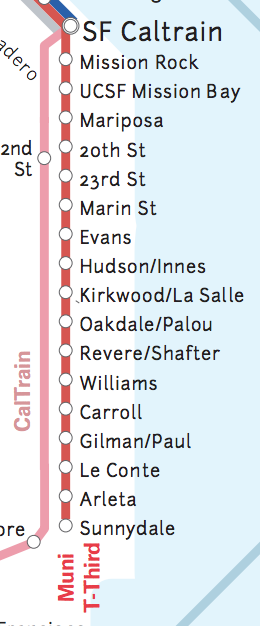
-
Labels look very different in the two labeled segments below, San Diego—Tijuana and SF Caltrain—Sunnydale.
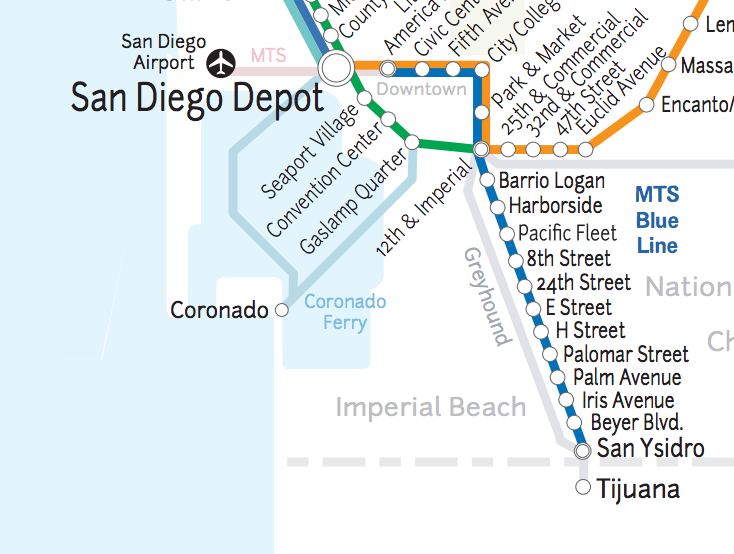
↩︎
-
The conflict between diagrammatic and geographically accurate maps rages on! From Harry Beck's famous map of the London Underground to Massimo Vignelli's controversial "diagram" of the New York City subway, people have argued about which style is superior for decades. ↩︎
-
Excursion and scenic railroads like the [Tioga Central Railroad](https://en.wikipedia.org/wiki/Tioga_Railroad) and the [Electric City Trolley Museum](https://en.wikipedia.org/wiki/Electric_City_Trolley_Museum) stick out in otherwise empty space here, whereas practical transit services (whether bus or rail) occupy almost all the space in the California map. ↩︎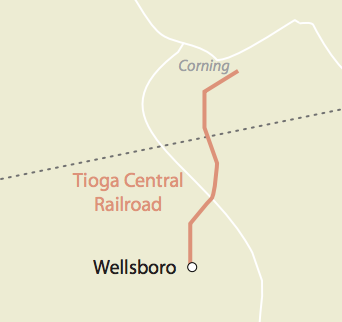
-
Rick Aschmann's map of North American English dialects is another famously ugly map that is stuffed full of fascinating information. ↩︎
-
Look at ['transit view'](google-maps.png) in Google Maps for an example of this bias. Rail lines, even slow local light rail, get special bold colors and station location markers. But buses are an undifferentiated mass, and you don't even see any bus stops until you zoom in practically to the centimeter level. But [buses are *not* all equal](http://calurbanist.com/san-francisco-frequent-transit/), and some can be just as frequent, just as fast, and just as much of a 'backbone' as the light rail and BART lines. ↩︎
- Jarrett Walker [suggests](http://www.humantransit.org/human-transit-the-book-introduction.html) that this tendency is motorist's bias: if you have a car, you don't wait before you start your trip, so you don't think that wait time counts as part of the overall trip time. But if you want transit to liberate people, it's got to have low wait time (high frequency). A bus that takes 45 minutes to make a trip, but comes every 10 minutes, beats an hourly train that makes the same trip in 20 minutes. ↩︎